

⚠️This article is for educational and engineering purposes only. It does not constitute financial advice, investment recommendations, or trading signals. Use the information at your own risk. Currency markets are volatile, and you should do your own research before making any financial decisions.
Currency markets often feel like standing on a shoreline. Slow tides rise and fall, smaller waves crash on top, and sometimes storms disrupt everything! This is the biases for an idea i had called the tides, or ocean model.
The Long Tide: The big swells that lift or lower all boats. In markets, this is the slow trend captured by an adaptive moving average.
The Short Tide: The quick in-and-out waves. In markets, these are the short-term reversals we track with a trailing reverse line.
The Storm Surges: Sudden shocks from the weather. In crypto, this is Twitter sentiment, where one influential tweet can make or break a trade.
The goal: align trades with both tides, but pause or adjust when a storm blows in!
We’ll break this down into math, C# implementations, and how to combine them across timeframes for assets like ETH, IMX, and GODS.
System Architecture
At a high level, the model has three components:
Price Indicators (NRMA, NRTR)
- Run separately on long intervals (daily, weekly) and short intervals (3m, 5m).
- Each produces trend and reversal markers.
Sentiment Layer
- Tracks influencer Twitter accounts for each coin.
- Produces a normalized “storm surge” score.
Composite Signal Logic
- Combines long tide, short tide, and sentiment into actionable trades.
Indicator Engineering
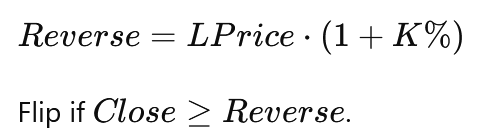
Nick Rypock Trailing Reverse (NRTR)
The short tide is modeled with NRTR, a trailing stop algorithm that flips trend when price crosses a reversal line.
Formulas:
- In uptrend:
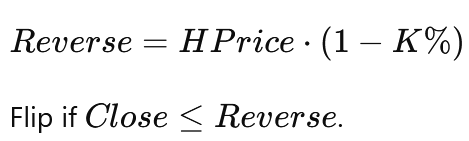
- In downtrend:
C# Implementation:
public class NRTR
{
    public double K { get; private set; }
    public double Trend { get; private set; }
    public double HPrice { get; private set; }
    public double LPrice { get; private set; }
    public double Reverse { get; private set; }

    public NRTR(double k, double initialPrice)
    {
        K = k;
        Trend = 1; // assume initial uptrend
        HPrice = initialPrice;
        LPrice = initialPrice;
        Reverse = initialPrice;
    }

    public double Calculate(double close)
    {
        if (Trend >= 0)
        {
            if (close > HPrice)
                HPrice = close;

            Reverse = HPrice * (1 - K * 0.01);
            if (close <= Reverse)
            {
                Trend = -1;
                LPrice = close;
                Reverse = LPrice * (1 + K * 0.01);
            }
        }

        if (Trend <= 0)
        {
            if (close < LPrice)
                LPrice = close;

            Reverse = LPrice * (1 + K * 0.01);
            if (close >= Reverse)
            {
                Trend = 1;
                HPrice = close;
                Reverse = HPrice * (1 - K * 0.01);
            }
        }

        return Reverse;
    }
}
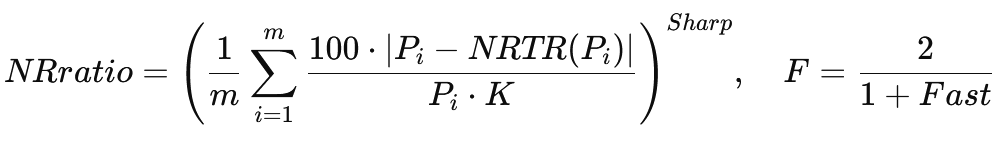
Nick Rypock Moving Average (NRMA)
The long tide is modeled with NRMA, an adaptive EMA where volatility is defined by deviations from NRTR.
Formulas:
 Where:
C# Implementation:
public class NRMA
{
    public double K { get; private set; }
    public int Fast { get; private set; }
    public int Sharp { get; private set; }
    public NRTR nrtr { get; private set; }
    public double prevNRMA { get; private set; }

    public NRMA(double k, int fast, int sharp, double initialPrice)
    {
        K = k;
        Fast = fast;
        Sharp = sharp;
        nrtr = new NRTR(k, initialPrice);
        prevNRMA = initialPrice;
    }

    public double Calculate(double close, double[] recentCloses)
    {
        if (recentCloses.Length <= Fast)
        {
            prevNRMA = close;
        }
        else
        {
            double oscSum = 0;
            var count = Math.Min(3, recentCloses.Length);

            for (var i = recentCloses.Length - count; i < recentCloses.Length; i++)
            {
                double deviation = 100 * Math.Abs(recentCloses[i] - nrtr.Calculate(recentCloses[i])) / recentCloses[i];
                oscSum += deviation / K;
            }

            double oscAvg = oscSum / count;
            var NRratio = Math.Pow(oscAvg, Sharp);
            double F = 2.0 / (1 + Fast);

            prevNRMA += NRratio * F * (close - prevNRMA);
        }

        return prevNRMA;
    }
}
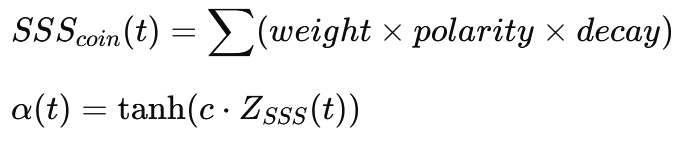
Sentiment Scoring from Twitter
Instead of monitoring the entire internet, the model watches curated influencer accounts per coin (e.g., Vitalik for ETH, Immutable devs for IMX, Gods Unchained accounts for GODS).
Pareto Principle in Sentiment Design
Not all voices on Twitter move markets equally. In fact, by the Pareto principle, roughly 20% of accounts generate 80% of meaningful price impact.
Instead of processing millions of tweets, the model only tracks curated influencer accounts for each asset:
- For ETH, that might mean Ethereum core devs and Vitalik.
- For IMX, Immutable team members.
- For GODS, the Gods Unchained project leads.
This drastically reduces cost and noise, while retaining the majority of predictive power.
The result is a lightweight, event-driven storm surge model instead of a full-blown NLP pipeline.
Formulas:
C# Implementation:
public class TwitterSentiment
{
    private readonly Dictionary<string, int> _weights;
    private readonly List<(DateTime, int, int)> _events;

    public TwitterSentiment(Dictionary<string, int> influencerWeights)
    {
        _weights = influencerWeights;
        _events = new List<(DateTime, int, int)>();
    }

    public void AddTweet(string account, string text)
    {
        int polarity = ClassifyPolarity(text);
        if (_weights.TryGetValue(account, out int weight))
            _events.Add((DateTime.UtcNow, polarity, weight));
    }

    public double CalculateScore(TimeSpan halfLife)
    {
        double sum = 0;
        foreach (var (timestamp, polarity, weight) in _events)
        {
            double ageHours = (DateTime.UtcNow - timestamp).TotalHours;
            double decay = Math.Pow(0.5, ageHours / halfLife.TotalHours);
            sum += weight * polarity * decay;
        }
        return sum;
    }

    private int ClassifyPolarity(string text)
    {
        string lower = text.ToLower();
        if (lower.Contains("hack") || lower.Contains("exploit") || lower.Contains("lawsuit"))
            return -1;
        if (lower.Contains("launch") || lower.Contains("upgrade") || lower.Contains("partnership"))
            return 1;
        return 0;
    }
}
Multi-Timescale Integration
We maintain two indicator sets per asset:
- Long Tide: NRMA-long, NRTR-long → daily/weekly candles.
- Short Tide: NRMA-short, NRTR-short → 3m/5m candles.
Composite Signal Logic:
- Long if both long + short are bullish and sentiment ≥ 0.
- Short if both long + short are bearish and sentiment ≤ 0.
- No trade otherwise.
Example (Eth):
double ethLong = nrmaLong.Calculate(dailyClose, dailyRecentCloses);
double ethLongRev = nrtrLong.Calculate(dailyClose);

double ethShort = nrmaShort.Calculate(min5Close, min5RecentCloses);
double ethShortRev = nrtrShort.Calculate(min5Close);

double ethSentiment = twitterEth.CalculateScore(TimeSpan.FromHours(3));

if (ethLong > ethLongRev && ethShort > ethShortRev && ethSentiment >= 0)
    Console.WriteLine("ETH Long");
else if (ethLong < ethLongRev && ethShort < ethShortRev && ethSentiment <= 0)
    Console.WriteLine("ETH Short");
else
    Console.WriteLine("No Trade");
Closing
By structuring the market like an ocean system, tides, waves, and storms. We get a model that's both intuitive and implementable.
- NRTR and NRMA provide the price structure.
- Twitter sentiment adds a low-cost shock filter.
- Multi-timescale integration ensures coherence.
This is not a trading strategy by itself, but a blueprint for engineers to test, refine and learn. There are many variables in the algorithms above which are purposefully not explained. I also did not provide weights for the social scoring algorithm which is likely better replaced with an ai driven sentiment model rather than a simple word database! These are issues left to the reader to solve.
⚠️This article is for educational and engineering purposes only. It does not constitute financial advice, investment recommendations, or trading signals. Use the information at your own risk. Currency markets are volatile, and you should do your own research before making any financial decisions.